Tap water lab report for 3,766 US cities
How hard is your tap water?
Hardness in mg/L and grains per gallon from utility reports, plus the EPA record of the water system behind your tap.
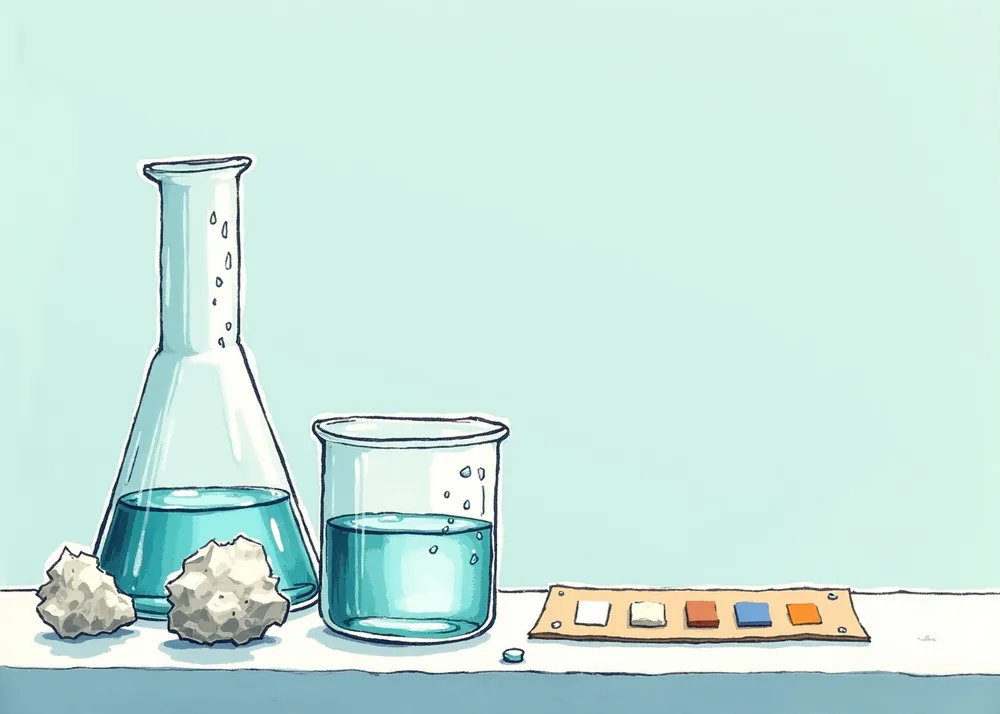
The hardness scale
Classes from the US Geological Survey. Hardness is calcium and magnesium dissolved in water, reported as calcium carbonate. One grain per gallon is 17.1 mg/L.
Hardness by state
- Alabama73
- Alaska110
- Arizona180
- Arkansas39
- California121
- Colorado97
- Connecticut53
- Delaware87
- District of Columbia117
- Florida120
- Georgia28
- Hawaii55
- Idaho118
- Illinois139
- Indiana178
- Iowa183
- Kansas138
- Kentucky134
- Louisiana102
- Maine16
- Maryland105
- Massachusetts38
- Michigan112
- Minnesota160
- Mississippi38
- Missouri121
- Montana116
- Nebraska149
- Nevada232
- New Hampshire20
- New Jersey80
- New Mexico137
- New York31
- North Carolina31
- North Dakota133
- Ohio113
- Oklahoma152
- Oregon24
- Pennsylvania127
- Rhode Island42
- South Carolina32
- South Dakota124
- Tennessee89
- Texas112
- Utah231
- Vermont62
- Virginia65
- Washington36
- West Virginia106
- Wisconsin170
- Wyoming191
Largest cities
- New York, NY31 mg/LSoft · 1.8 gpg
- Los Angeles, CA121 mg/LHard · 7.1 gpg
- Chicago, IL139 mg/LHard · 8.1 gpg
- Houston, TX96 mg/LModerately hard · 5.6 gpg
- Phoenix, AZ237 mg/LVery hard · 13.9 gpg
- Philadelphia, PA127 mg/LHard · 7.4 gpg
- San Antonio, TX179 mg/LHard · 10.5 gpg
- San Diego, CA225 mg/LVery hard · 13.2 gpg
- Dallas, TX112 mg/LModerately hard · 6.5 gpg
- Jacksonville, FL189 mg/LVery hard · 11.1 gpg
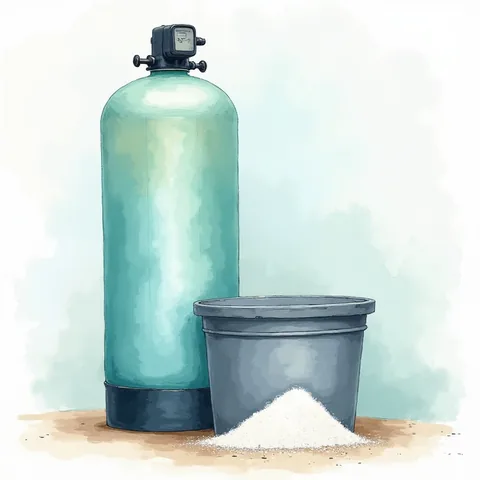
What size softener do you need?
Multiply hardness in grains per gallon by the water your household uses in a day. That gives grains per day, and the softener's capacity should cover about a week of it. The calculator does the arithmetic and shows how often each size would regenerate.
Where the numbers come from
Hardness comes from the TapWaterData US Water Hardness dataset. Most cities have a figure from their utility's own water quality report; a few hundred have a county estimate from field samples instead, and those pages say so up front.
On top of that we add the water system's record from EPA's Safe Drinking Water Act database: 3,654 city pages show health-based violations since 2016, plus monitoring slips. More on the method.