Hard water in Youngstown, OH
County estimate from 888 water samples in Mahoning County · July 2026
- OH typical
- 113 mg/L
- EPA health violations since 2016
- 0
- Softener for 3 people
- 24k grain
- Data
- County estimate
Water samples from around Youngstown put hardness at about 177 mg/L (10.3 gpg), which would be hard on the USGS scale. Treat this as a rough guide: it is the median of 888 samples taken across Mahoning County, mostly wells and streams, not a test of Youngstown's treated tap water. One more reason for caution: EPA lists Youngstown's water system as using surface water, which is often softer than the wells behind the county figure.
Youngstown sits 64 mg/L above the typical Ohio figure of 113. Of the 10 nearest cities we track, 5 have softer water and 5 have harder. The range nearby runs from 104 mg/L in Hudson to 285 in Alliance.
What 177 mg/L means at home
Expect white crust on faucets and showerheads, plus spots on dishes that come out of the dishwasher.
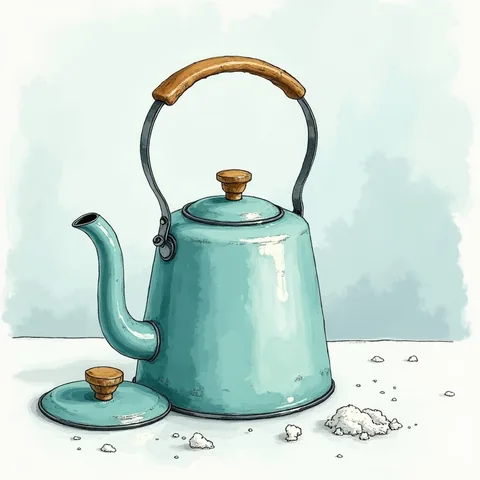
Kettles collect scale quickly. Water heaters build up sediment at the bottom of the tank, which makes them work harder over time.
Soap and detergent need a little more to lather, and soap scum shows up in the tub.
Hardness is not a health problem, and EPA sets no limit for it. It is a matter of scale and soap.
What to do about it
At 177 mg/L most of the trouble is scale, and only a few things deal with it.
Ion-exchange water softener
The standard whole-house fix. It swaps calcium and magnesium for sodium or potassium and needs salt plus a drain. Size it with the calculator below.
Salt-free conditioner
No salt and no drain line. It changes how minerals form scale instead of removing them, so water still tests hard.
Reverse osmosis or carbon filter
Under-sink reverse osmosis removes minerals from drinking water only. Plain carbon filters improve taste but do not soften.
3 people × 75 gallons a day × 10.3 gpg = 2,329 grains a day. A 24,000-grain unit regenerates about every 10 days.
EPA record for Youngstown's water system
No health-based violations since 2016
Serves about 130,530 people from surface water.
- Health-based
- 0
- Monitoring or reporting
- 2
- Open now
- 0
EPA lists this system as serving Youngstown.
Health-based means a contaminant above its legal limit or a missed treatment step. Monitoring and reporting violations are late or missing tests and notices. Source: EPA ECHO, 2026Q3 export, violations with periods starting 2016 or later. Full EPA record.
Questions
Is Youngstown water hard?
Yes. It measures about 177 mg/L (10.3 grains per gallon), which the USGS classes as hard.
What is the water hardness in Youngstown in grains per gallon?
About 10.3 gpg. One grain per gallon equals 17.1 mg/L, so 177 mg/L divided by 17.1 gives 10.3.
What size water softener do I need in Youngstown?
For 3 people using 75 gallons each per day, 10.3 gpg works out to about 2,329 grains a day. A 24,000-grain softener covers that with a regeneration about every 10 days.
Has the Youngstown water system had EPA violations?
EPA records show no health-based violations for Youngstown City PWS since 2016. There were also 2 monitoring or reporting violations, which are about late or missing tests and notices.
Nearby cities
- Warren148 mg/LHard
- Alliance285 mg/LVery hard
- Kent188 mg/LVery hard
- Aurora117 mg/LModerately hard
- Bainbridge117 mg/LModerately hard
- Stow220 mg/LVery hard
- Reminderville117 mg/LModerately hard
- Hudson104 mg/LModerately hard
- Canton285 mg/LVery hard
- Green220 mg/LVery hard
Hardness data: TapWaterData US Water Hardness (county estimate, July 4, 2026), CC BY 4.0. Population: US Census Bureau. Violations: EPA ECHO. How we use them.